


As machine learning (ML) enters the architectural domain, it has produced a stunning portfolio of city-scale imagery. Yet a practical question remains: How do we actually use it? Many ML-driven projects end at analysis, classifying patterns without yielding prescriptive guidance a designer can deploy. The results are captivating but often difficult to reproduce, adapt, or teach.
This article proposes a two-act workflow that treats ML and rule-based design as distinct yet tightly coupled partners. Act 1 uses ML for scenario visualization, generating novel 2D top-view maps of possible futures. Act 2 treats these maps as a designable site, applying a human-authored rule set to procedurally assemble 3D prototypes. The goal is to move beyond one-off images toward a methodology of transparency, auditability, and reproducibility.
Act 1 — The Oracle: ML-Generated Top-View Scenarios
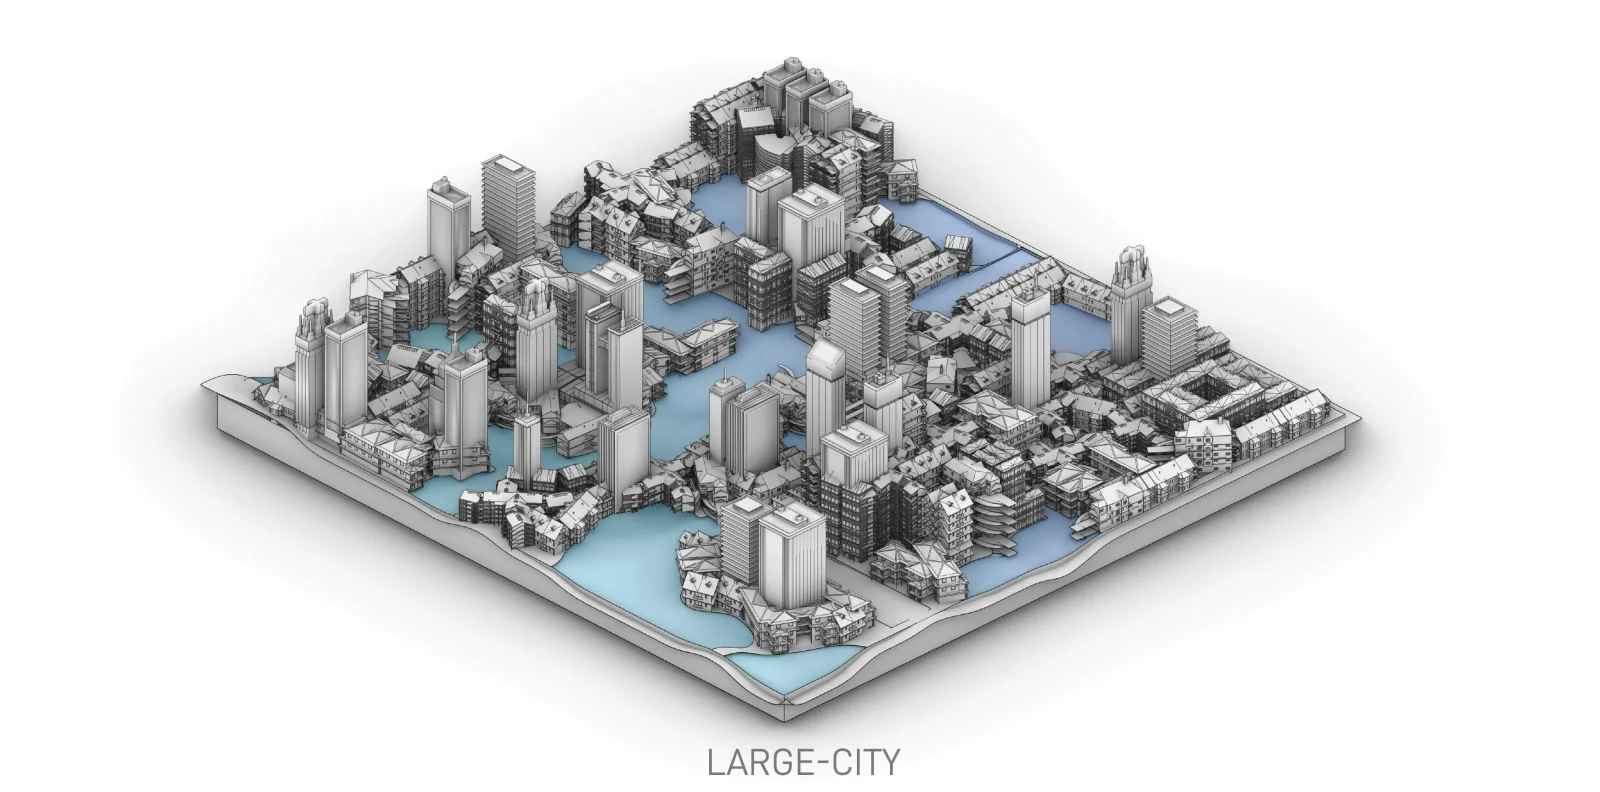
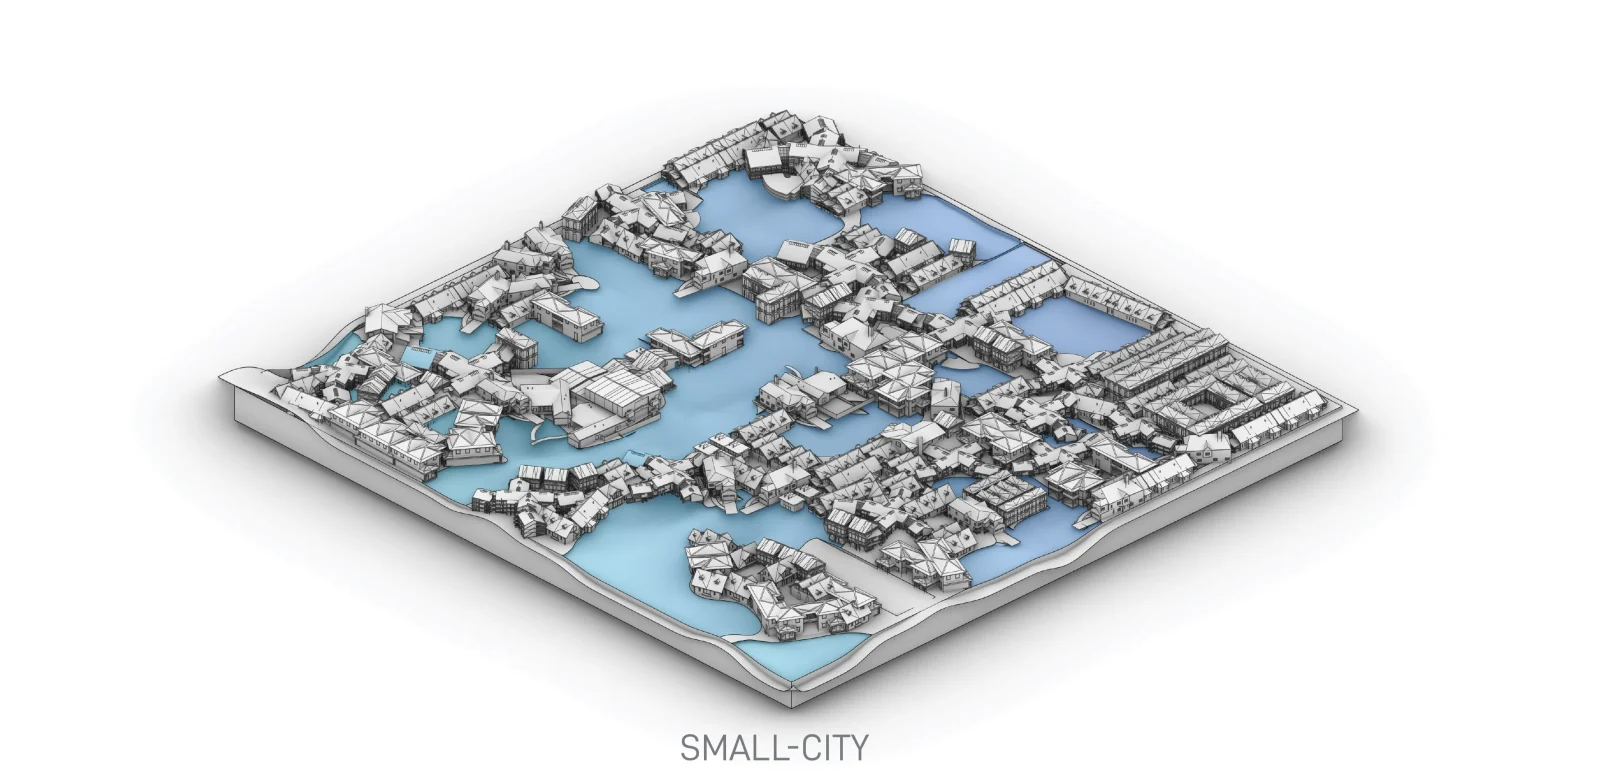
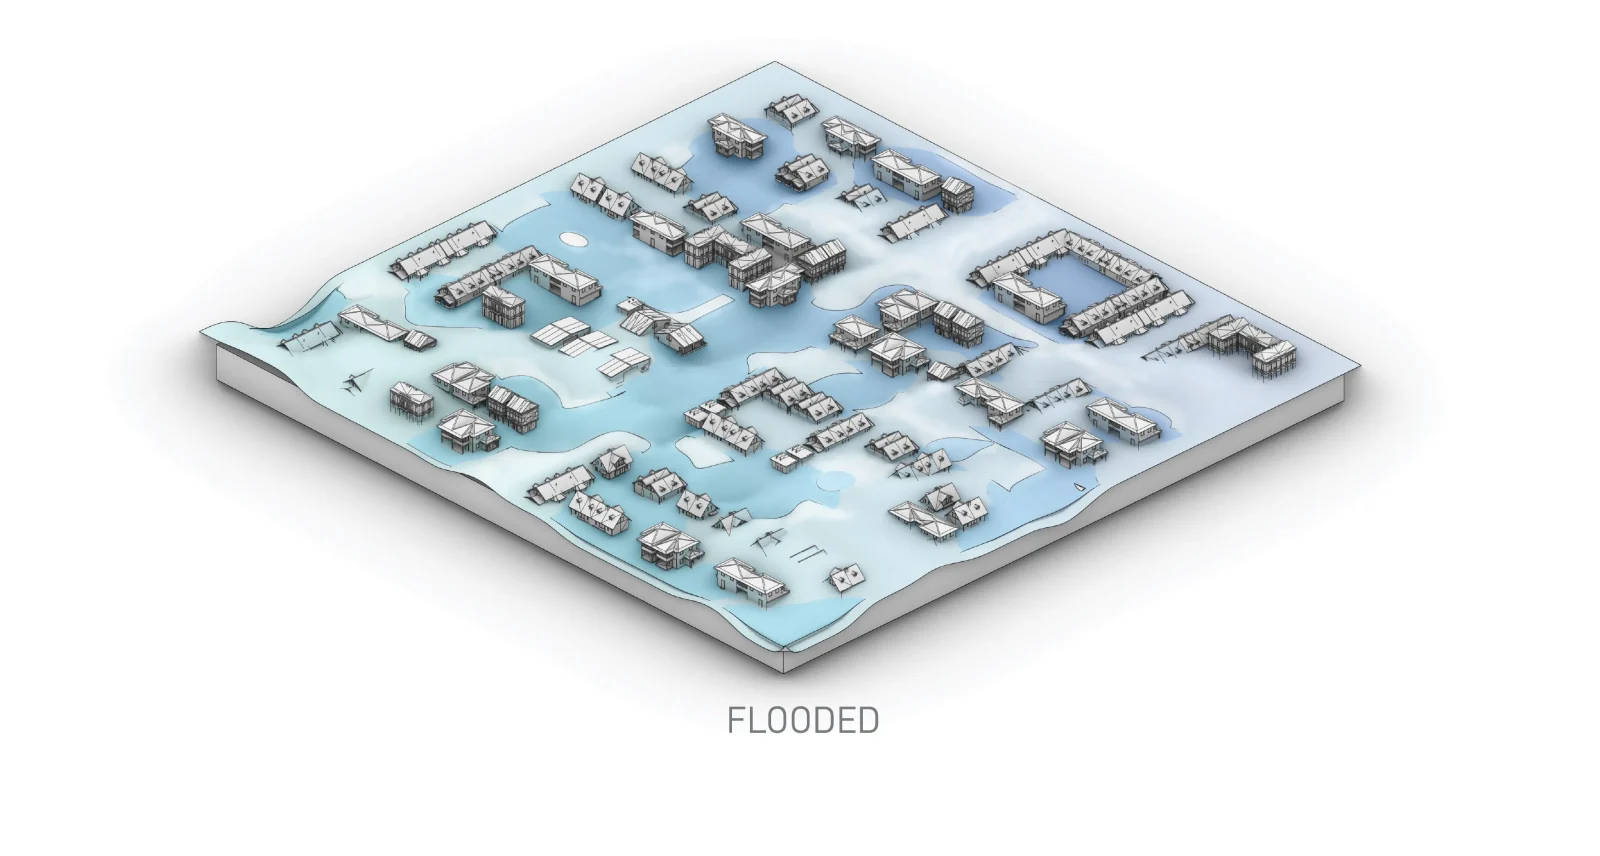
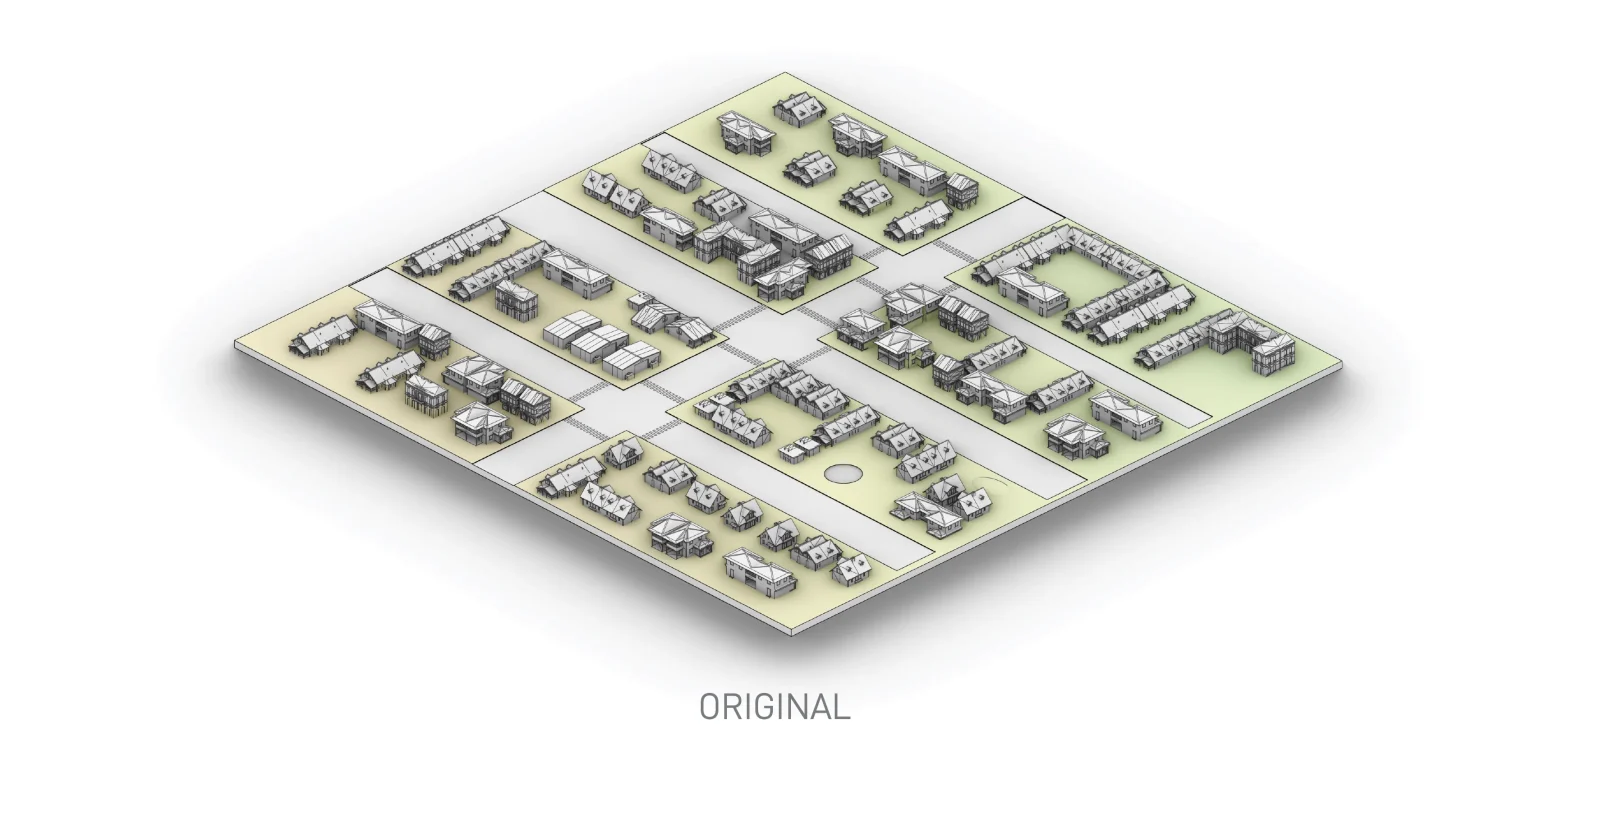
We begin with a specific place, Phnom Penh, and a question about its potential futures under climate pressure and speculative development. Using an image-to-image ML model, we expose the baseline top view to morphological archetypes: a flooded delta/wetland condition, the canal logic of Venice, and the orthogonal density of Chicago (all at city-scale, top-view). The model is trained/fine-tuned on representative datasets so it can translate spatial traits, not merely textures, into new maps.
The outcome is a four-stage morphology transfer: Original → Flooded → Small-City (Venice-like) → Large-City (Chicago-like). The ML does not produce a 3D model; rather, it produces rich, design-legible 2D maps, the site for Act 2.
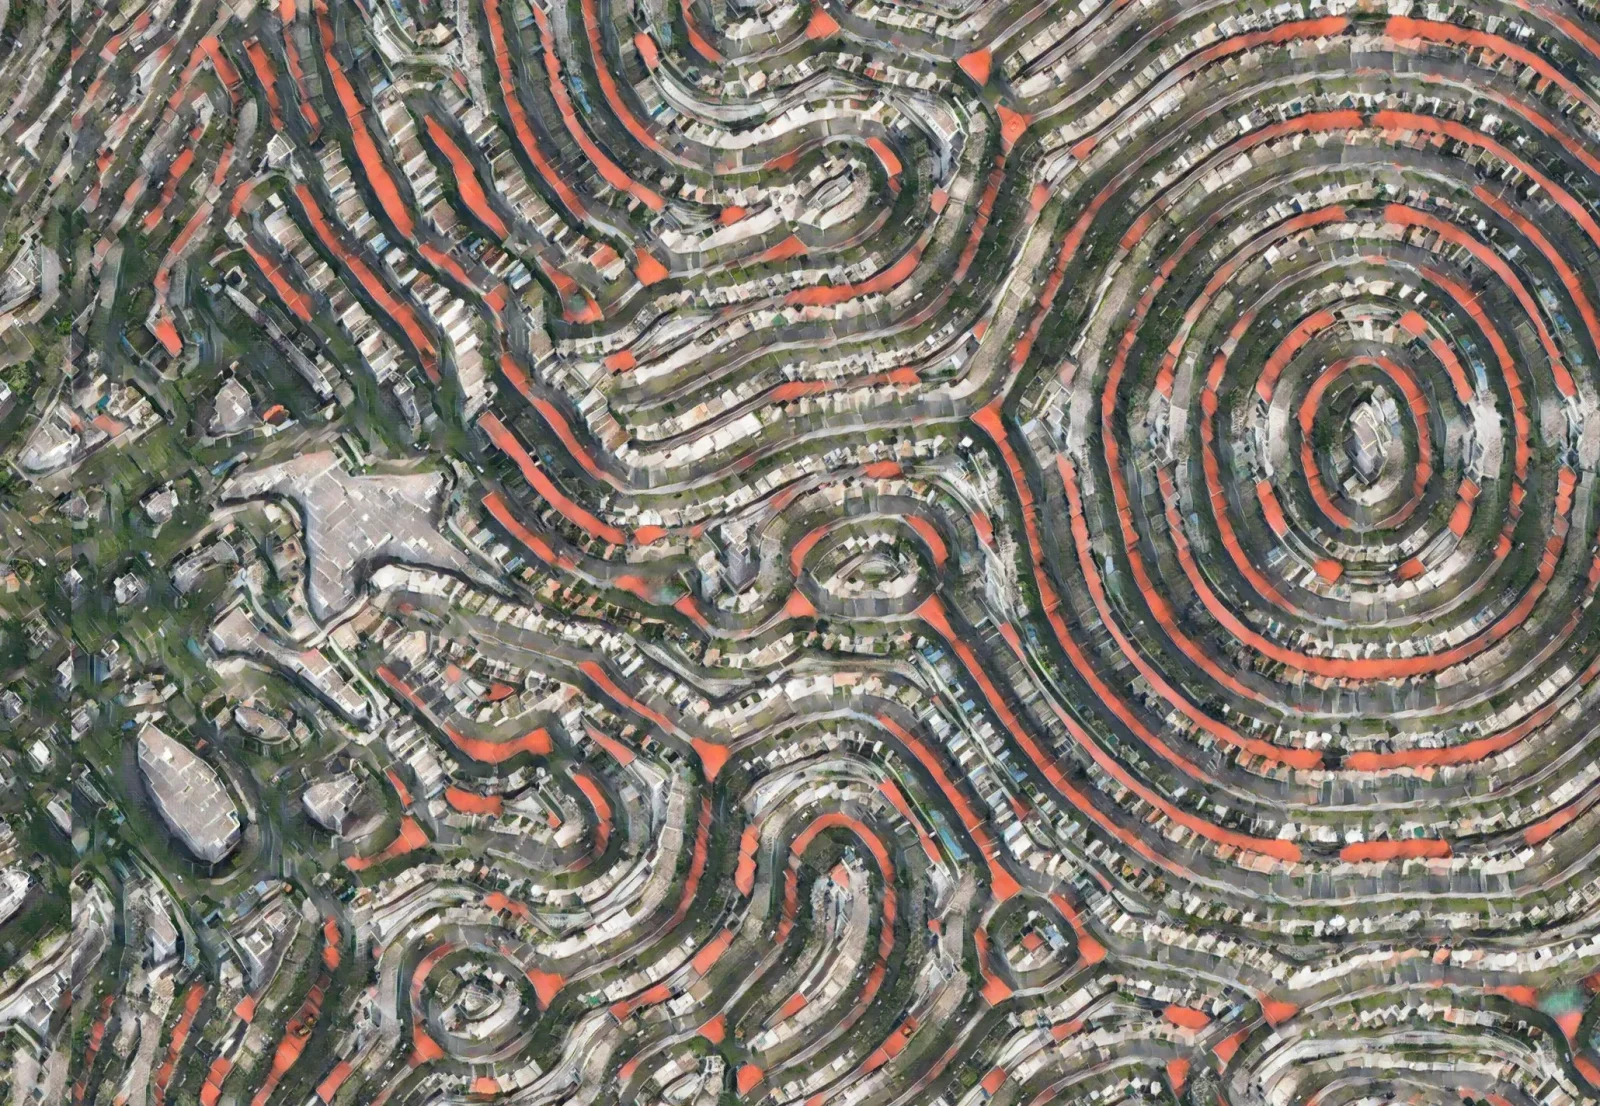
Figure 0 — ML-generated top view. A morphology-transferred satellite image exemplifying the city-scale scenarios produced in Act 1.

Figure 1 — Four-Stage Scenario Set.
A baseline top view of Phnom Penh is morphed into flooded, small-city (canal/archipelago), and large-city (dense grid) variants. These generated 2D maps become the foundation for rule-based 3D assembly.
(Image placement: a single 4-panel figure showing the progression.)


Act 2 — The Architect: Rule-Based 3D Assembly
With the Act 1 “hybrid map” in hand, we switch from machine learning to architectural intelligence. The map encodes water/land, permeable edges, and logistics paths. We author a Rule Table—a concise dashboard of quantified ranges, and implement it through procedural assembly in Grasshopper.
Defining the Rule Table.
Rules reflect urban and programmatic needs (e.g., logistics for e-waste processing):
Façade porosity (primary edges): 30–45%
Service buffers (secondary edges): 3–6 m, loading bays 0–2
Through-block cuts: 6–12 m
These are designer-authored ranges, normalized from scenario cues to be deployable.
Figure 2 — Rule Table.
A prescriptive dashboard translating analysis into actionable parameters. The table defines quantifiable ranges for porosity, service/loading, and through-block cuts.

Procedural Assembly.
A Grasshopper script operationalizes the rules, reading the Act 1 top-view as a site and placing parameterized components (Blocks / Canals / Connectors) from a kit of parts. The result is a city-scale prototype whose logic is explicit and repeatable.
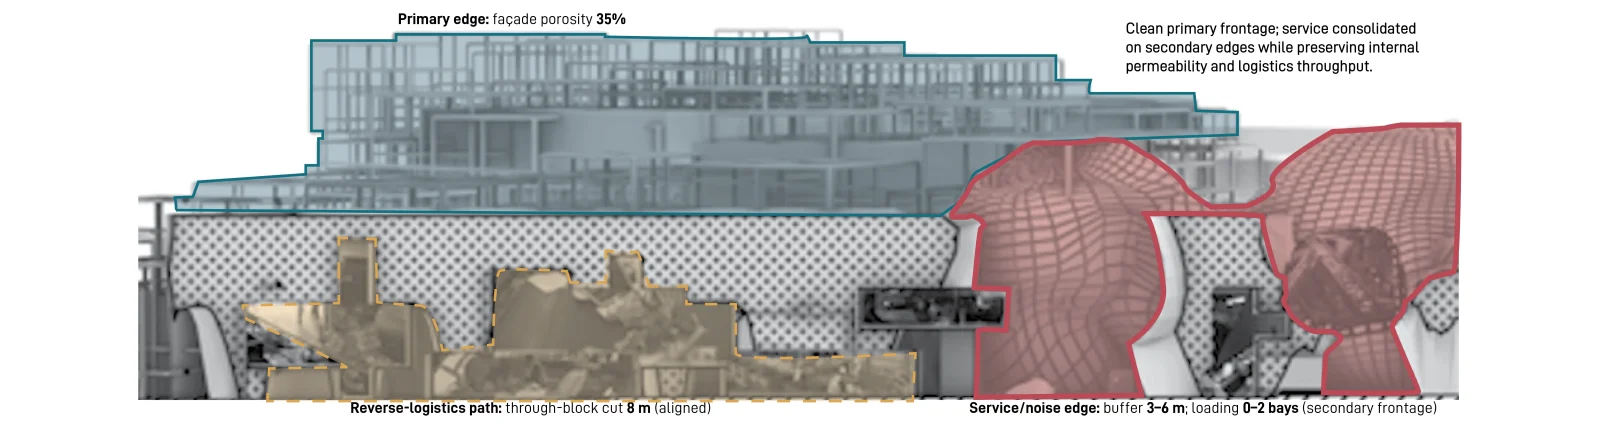
Figure 3 — Rule Deployment (Plan/Axonometric).
This elevation demonstrates the rules from Figure 2 deployed onto a prototype. Aligned with the Act 1 map, primary edges (blue outline) receive their target 35% porosity, while the reverse-logistics path (orange highlight) is preserved as a continuous cut, showcasing a fully designer-led process.
(Legend: Blue = Permeable edge, Orange = Service/Noise, Green = Through-block.)

Reproducibility and Controlled Variation
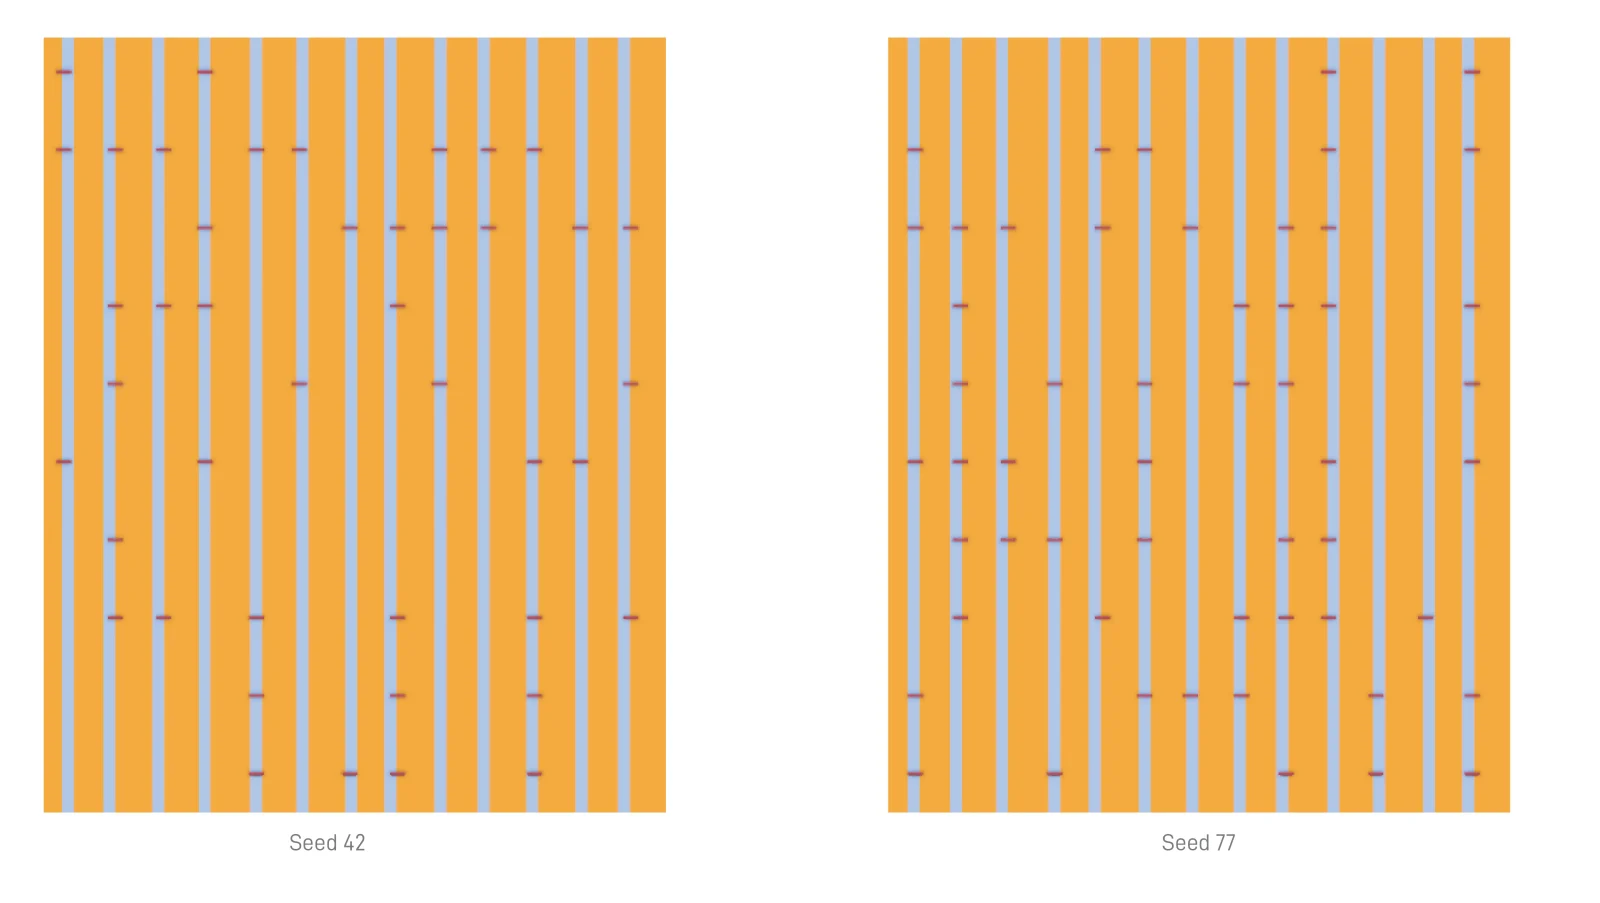
A key strength of the workflow is its balance of consistency and variation. Using the same rule set but changing a single input, the seed, the assembly graph produces outcomes that are stylistically coherent yet non-repeating. In practice, the seed controls the pseudo-random sequence driving local variations (e.g., canal jitter, connector placement), while the rules remain constant.
Figure 4 — Seeded Assembly Graph (Seed 42 vs. 77).
Same rules, different seeds → layout varies, logic persists. This demonstrates reproducibility with controlled variety.

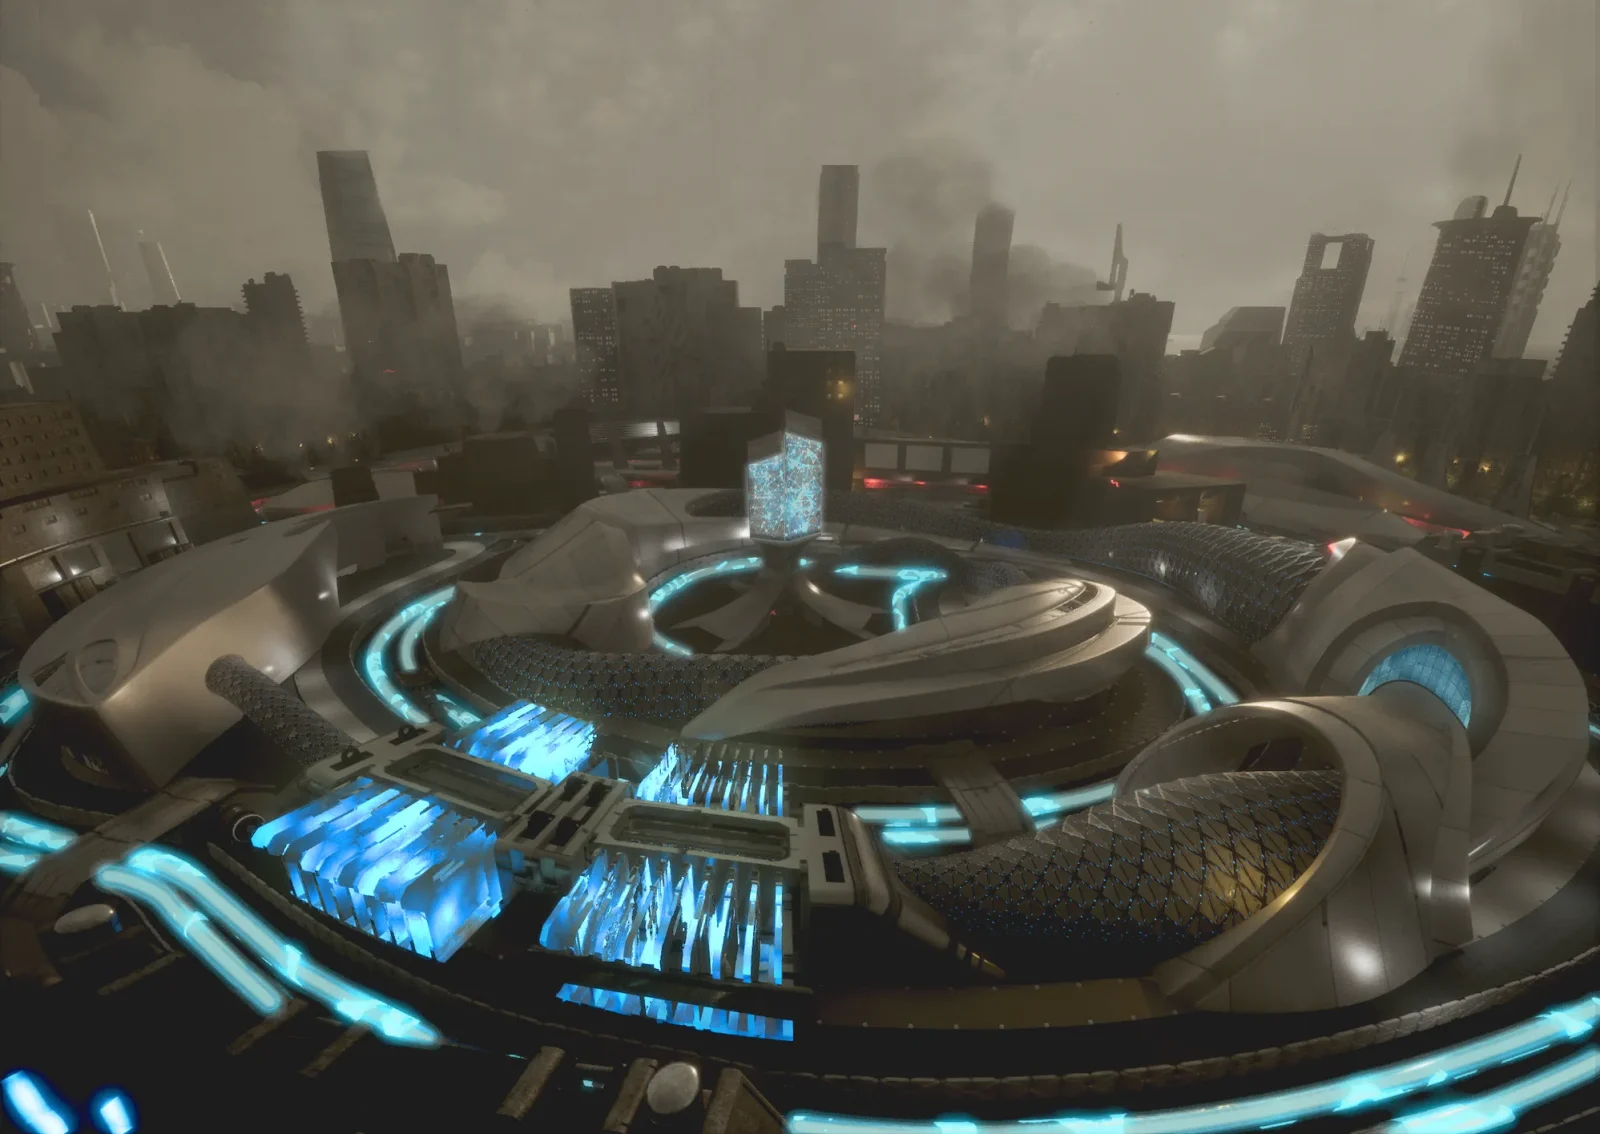
Figure 5 — Final Render (Perspective). High-resolution visualization of the Phnom Penh prototype under e-waste logistics scenario.

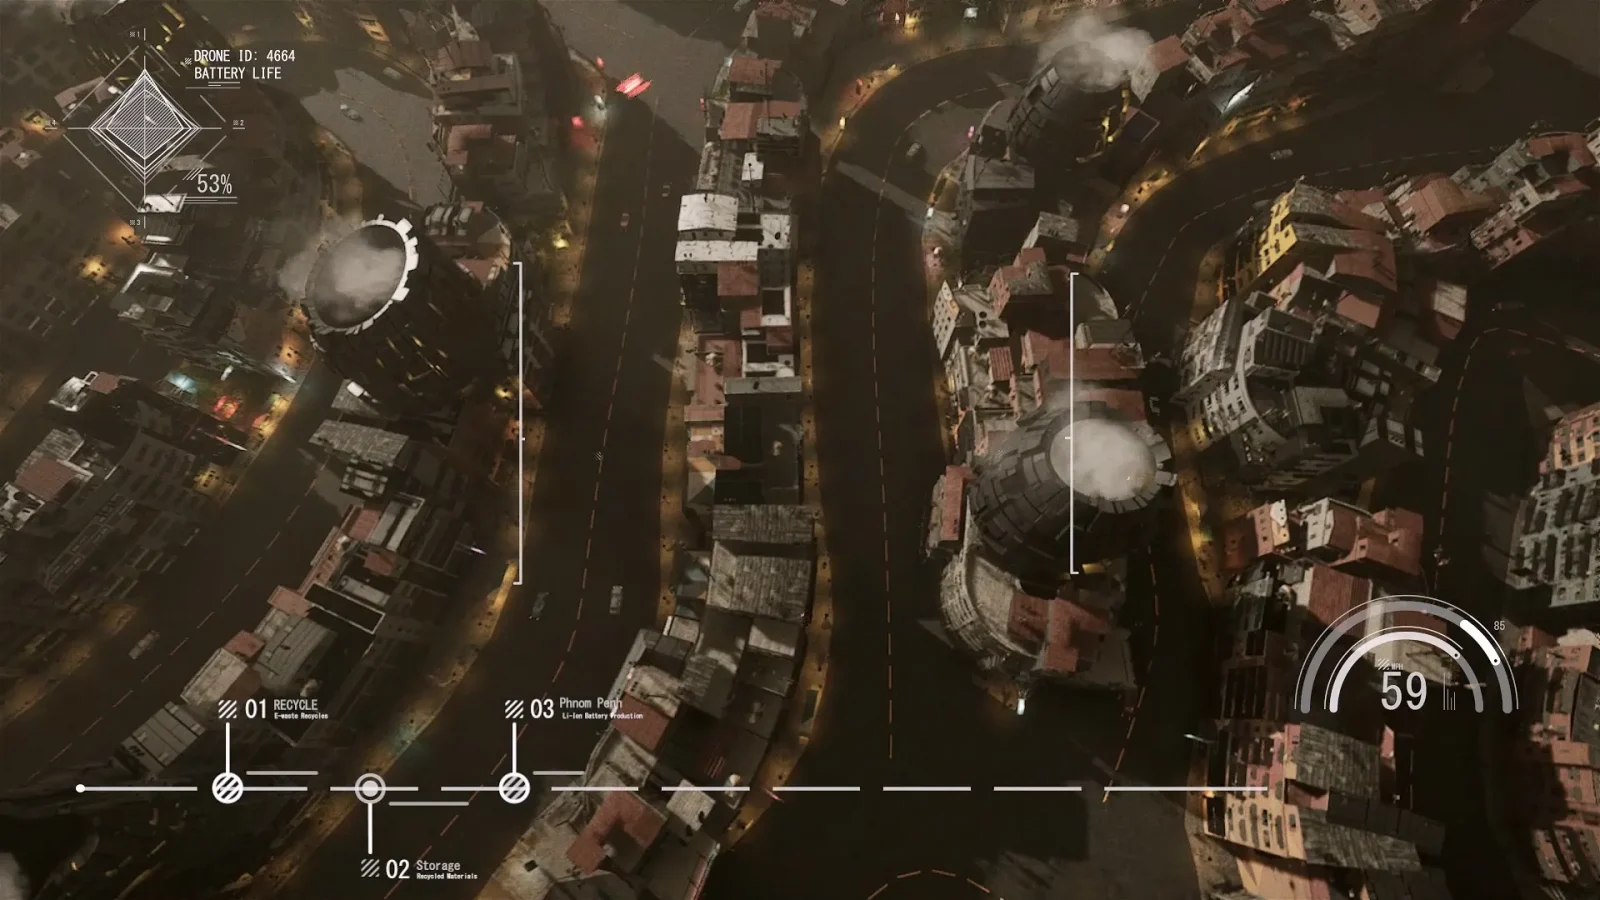
Figure 6 — Final Render (Axonometric). Alternate view emphasizing system-scale assembly and urban form.

Conclusion — Beyond the Image
This two-act workflow integrates ML into architectural practice meaningfully. By separating speculative image generation from rule-based assembly, it yields a transparent, auditable, and reproducible pipeline, useful in studio teaching and in practice. The method positions ML not as a replacement for design intelligence but as a collaborator that expands how we imagine and build city-scale proposals.
Keywords
Morphology Transfer; Scenario Visualization; Rule Normalization; Procedural Assembly; Seed Variation; Computational Design; Urban Design; Grasshopper; UCLA
Credits
Author: Weonwoo (Won) Choi
Advisers: Benjamin Ennemoser, Güvenç Özel
Key Collaborators: Onur Koyun, Zhi Zhou,
Tools: Rhino/Grasshopper (for Rule-Based Assembly), PyTorch (for CycleGAN-based ML Training), Unreal Engine (for Visualization)
References: UCLA AUD Student Work Archive (project pages)
Follow-up Links (QR demos)
Note: Base satellite imagery is used for research illustration; sources are credited per figure captions.

.jpg "Fran Silvestre - Rethinking Architecture")


.jpg2.jpg "Carlo Ratti - Rethinking Architecture")


